- News
- Reviews
- Bikes
- Accessories
- Accessories - misc
- Computer mounts
- Bags
- Bar ends
- Bike bags & cases
- Bottle cages
- Bottles
- Cameras
- Car racks
- Child seats
- Computers
- Glasses
- GPS units
- Helmets
- Lights - front
- Lights - rear
- Lights - sets
- Locks
- Mirrors
- Mudguards
- Racks
- Pumps & CO2 inflators
- Puncture kits
- Reflectives
- Smart watches
- Stands and racks
- Trailers
- Clothing
- Components
- Bar tape & grips
- Bottom brackets
- Brake & gear cables
- Brake & STI levers
- Brake pads & spares
- Brakes
- Cassettes & freewheels
- Chains
- Chainsets & chainrings
- Derailleurs - front
- Derailleurs - rear
- Forks
- Gear levers & shifters
- Groupsets
- Handlebars & extensions
- Headsets
- Hubs
- Inner tubes
- Pedals
- Quick releases & skewers
- Saddles
- Seatposts
- Stems
- Wheels
- Tyres
- Health, fitness and nutrition
- Tools and workshop
- Miscellaneous
- Cross country mountain bikes
- Tubeless valves
- Buyers Guides
- Features
- Forum
- Recommends
- Podcast
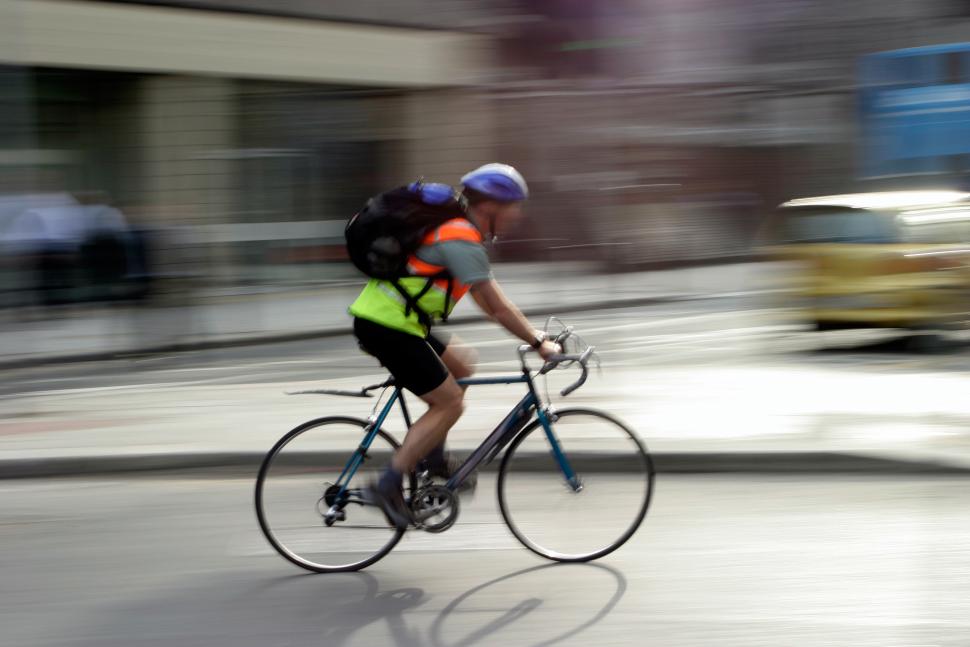
 Commuter cyclist
DfT figures reveal that cyclists rode further in 2014 – but drivers drove further too
New Department for Transport (DfT) figures reveal that the distance cycled on roads or next to roads in 2014 was 3.8 per cent higher than in 2013. Motor vehicle traffic also rose by 2.4 per cent – the fastest annual growth since 1996.
With 3.25bn miles travelled, UK cyclists covered more distance than either motorcycles or buses (both 2.8bn) and bike traffic has now risen every year since 2008.
However, greater distances have been covered in the past. Estimates began in 1949 with 14.7bn miles and while there was steady decline to an all-time low of 2.3bn miles in 1973, levels rose again to 4bn miles for three successive years in the early Eighties.
Nevertheless, the 2014 figure is the highest since 1991 with the data indicating that the increase from 3.1bn miles in 2013 has largely been down to growth in London, the South-East and the North-East, each of which shows an increase of 100 million miles.
Sustrans Policy Director, Jason Torrance, said the rise demanded greater cycling investment:
"It's heartening to see cycling on the rise yet again in these latest figures. More and more people are taking to bikes to avoid the cost, inconvenience and congestion that comes with running a car. The numbers also make the argument for more of the transport budget to be spent on cycling infrastructure even more compelling. Demand for cycling is swelling every year and Government must do more to help keep them safe and provide convenient routes.
"Our vision is to transform the UK so that everyone can choose to walk and cycle to school and work, for fun and transport. To do this we need a statement from the very top of Government to make walking and cycling a cross-departmental priority. We also need funding for cycling and walking equivalent to five per cent of the transport budget, and a Cycling and Walking Investment Strategy that contains a long-term vision and targets."
However, the DfT figures also reveal a marked rise in other forms of traffic. Motor vehicle traffic peaked at 314.1 billion vehicle miles in 2007 and then fell for three consecutive years – the first consecutive annual falls since traffic records began. Between 2010 and 2013 traffic remained largely stable, but it has again shown strong growth of 2.4 per cent from 2013 and 2014.
The DfT points out that it is not yet clear whether this growth is a fluctuation around a stable figure or a signal of a return to sustained growth, but it does say that this is the fastest annual growth since 1996.
Alex has written for more cricket publications than the rest of the road.cc team combined. Despite the apparent evidence of this picture, he doesn't especially like cake.
I've heard of the white man's burden, but a Belfry sounds like a mighty endeavour. So many Watts to get that moving. Chapeau!
If this government were truly interested in change, and joined up government between...
It's easy to remove the pipe from the fasteners which are C shaped so able to hold but not trap the pipe. Filtering through traffic is then...
And you know that because...? I'd read this elsewhere and was surprised to read the story on here - hadn't thought they were "cyclists".
85kg weight limit?! I come in well under that, but I'm not sure I'd trust a frame with a limit that low.
What was on offer only 2 weeks ago was either 'world' for £20 or tiny areas such as 'Blackpool area' for £5 each or something. You couldn't just...
“fastest, lightest, and most durable road tyres yet” Yeah right. "Strong, light, cheap. Pick two."
Surely a penalty notice will have been delivered by now, which will state where the car is parked?
A smidge of £8.5K. Seriously. Someone needs to have a strong coffee.